Wireshark and tcpdump are powerful tools used for network analysis and troubleshooting. To understand it better and visualise these tools, let’s dive into the details of Wireshark and compare it with tcpdump through a relatable story.
The Tale of Two Network Detectives
Imagine two detectives, Wanda (Wireshark) and Tom (tcpdump), who specialize in solving network mysteries. They work in the bustling city of Networkville, where data packets zoom around like cars on a highway.
Meet Wanda (Wireshark)
Wanda is a tech-savvy detective with a fancy gadget that displays colorful, interactive maps of Networkville’s traffic. She can see everything happening on the network in real-time, with a user-friendly interface that allows her to click, drag, and zoom into specific areas of interest.
Key Features of Wanda (Wireshark):
- Visual Interface: Wanda’s gadget (Wireshark) has a graphical user interface that displays network traffic in an easy-to-understand format.
- Detailed Analysis: She can dive deep into each data packet, examining its contents and structure with just a few clicks.
- Color Coding: Different types of network traffic are color-coded, making it easy for Wanda to spot patterns or anomalies at a glance.
- Filtering and Searching: Wanda can quickly filter out irrelevant information and search for specific types of traffic or data.
- Protocol Dissection: Her gadget automatically breaks down complex network protocols, making them easier to understand.
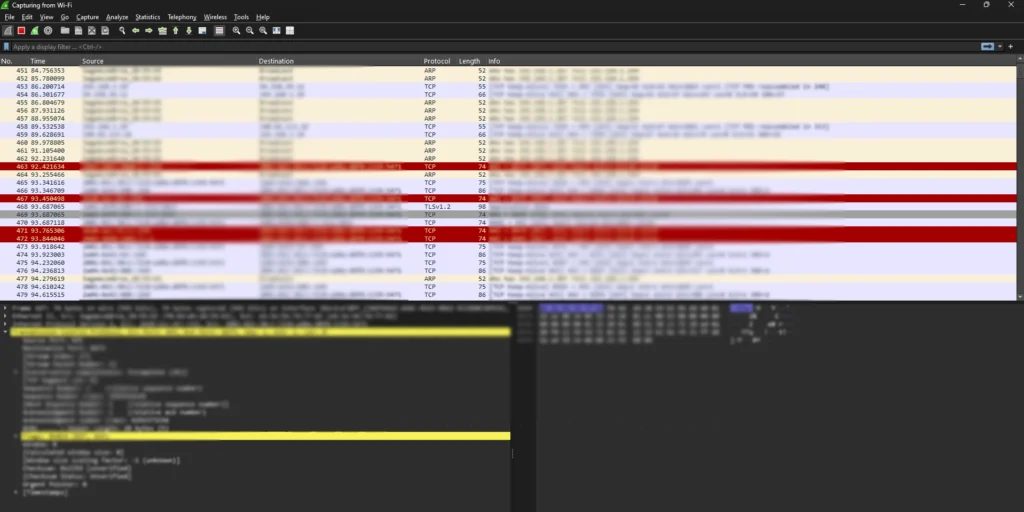
Wireshark logs capture network traffic in real-time, providing a detailed view of network packets. Each line in a Wireshark log represents a single packet, with various fields containing information about the packet’s source, destination, protocol, and contents. As in the image, wireshark interface is colorful and detailed. It is mostly self explanatory. Easy to understand as each info columns are well guided. One sample log for wiresark may be:
167 32.241643 2620:1ec:44:1:132 2001:864:30c1:7201:ad0a:d0f0:1159:5471 TCP 74 443 → 8473 [RST, ACK] Seq=1 Ack=1 Win=0 Len=0
And this log may be read as each space indicating another column.
Let’s break down the provided Wireshark log line par space:
167: This is the number of the captured packet in the Wireshark trace.
32.241643: This is the timestamp of the packet, measured in seconds since the Wireshark capture started.
2620:1ec:43::132: This is the source IP address of the packet. It’s in IPv6 format.
2001:861:30c1:7210:ad0a:d0f0:1159:5471: This is the destination IP address of the packet. It’s also in IPv6 format.
TCP: This indicates that the packet is using the Transmission Control Protocol (TCP). TCP is a reliable connection-oriented protocol commonly used for web traffic, email, and other data transfers.
74: This is the length of the packet in bytes.
443→8473: This shows the source port (443) and the destination port (8473) of the TCP connection. Port 443 is typically used for HTTPS (secure web traffic), while port 8473 could be a custom port used by a specific application.
[RST, ACK]: This indicates the flags set in the TCP header. In this case, the RST (reset) flag is set, which means the connection is being terminated abruptly. The ACK (acknowledgment) flag is also set, which acknowledges the receipt of the previous packet.
Additional TCP header fields:
- Seq=1: This is the sequence number of the packet, used for ordering packets within the TCP connection.
- Ack=1: This is the acknowledgment number, indicating the next sequence number expected from the other side.
- Win=0: This is the window size, which specifies how much data the receiver is willing to accept.
- Len=0: This is the length of the data carried by the packet, excluding the TCP header.
In summary, this Wireshark log line shows a TCP packet being sent from source ip to destination ip, abruptly terminating the connection.
To analyze Wireshark logs effectively, it’s essential to understand the different fields and protocols involved. You can use Wireshark’s filtering and analysis tools to focus on specific types of traffic and gain insights into network behavior.
Enter Tom (tcpdump)
Tom, on the other hand, is an old-school detective who relies on his trusty notepad (command-line interface). He jots down network traffic information in a compact, text-based format. While not as visually appealing as Wanda’s gadget, Tom’s method is lightweight and can be used in almost any situation.Key Features of Tom (tcpdump):
- Command-Line Tool: Tom’s notepad (tcpdump) is a text-based tool that captures and displays network traffic information in a terminal2.
- Lightweight: His method uses fewer resources, making it ideal for use on systems with limited capabilities2.
- Versatility: Tom can quickly capture traffic on remote servers or in environments where graphical interfaces aren’t available1.
- Scriptable: His notes can be easily integrated into automated scripts for continuous monitoring1.
The Great Network Mystery
One day, the mayor of Networkville reports that the city’s website is running slowly. Wanda and Tom are called in to investigate.Wanda’s Approach (Wireshark):
Wanda sets up her gadget to monitor the website’s traffic. She sees a colorful display of packets flowing in and out. Using her filtering tools, she quickly identifies an unusual pattern of requests coming from a specific IP address. With a few clicks, she dives deeper into these packets and discovers they’re part of a Distributed Denial of Service (DDoS) attack.Tom’s Approach (tcpdump):
Tom connects to the server hosting the website and uses his notepad to capture traffic. He types in a command to filter for HTTP traffic:
sudo tcpdump -i eth0 port 80He sees a flood of requests in his text output. By quickly scanning through the IP addresses, he notices a large number of requests from a single source, indicating a potential DDoS attack.
A sample log for tcpsump:
23:10:42.907281 IP api.snapcraft.io.https > 172.10.189.64: Flags [R], seq 3945161708, win 0, length 0
This tcpdump log line shows information about a network packet captured using the tcpdump tool. Here’s a breakdown of what it means:
Timestamp: 23:10:42.907281
- This indicates the time the packet was captured, in 24-hour format with millisecond precision. In this case, it was captured at 11:10 PM, 42 seconds and 907 milliseconds past the minute.
Source: IP api.snapcraft.io.https
- This shows the source of the packet. It identifies:
- IP: This refers to the Internet Protocol address of the sender, likely a device trying to access SnapCraft services.
- api.snapcraft.io.https: This specifies the hostname of the source, indicating it’s potentially using HTTPS (secure connection) to access SnapCraft’s API.
Destination: 172.10.189.64
- This indicates the destination of the packet. Here, it shows:
- IP: This is the IP address of the receiver, which appears to be a private network address (likely a server within the network).
- 55140: This is the port number the packet is sent to on the receiver. Ports are used to differentiate different services on a single server.
Flags: [R]
- This section specifies the flags set in the TCP header of the packet. In this case, only the R (Reset) flag is set. This signifies the sender is abruptly terminating the connection.
Seq: seq 3945161708
- This shows the sequence number of the packet. Sequence numbers are used by TCP to ensure data arrives in the correct order on the receiver’s side. This specific value (3945161708) doesn’t hold much meaning without context from previous packets.
Win: win 0
- This indicates the window size advertised in the TCP header. This value tells the receiver how much data the sender is willing to accept before requiring an acknowledgment. Here, a window size of 0 suggests the sender isn’t expecting any further data from the receiver.
Length: length 0
- This shows the length of the data portion of the packet, excluding the TCP header. In this case, the length is 0, meaning there’s no additional data sent with the packet.
This log line suggests that a device attempted to connect to SnapCraft’s API using HTTPS. However, the connection was abruptly terminated by the sender (the device initiating the connection) with a reset flag. We can’t determine the exact reason without further context, but it’s possible the device encountered an error or simply decided to cancel the request.
Collaboration and Resolution
Wanda and Tom combine their findings. Wanda’s visual analysis provides a clear picture of the attack pattern, while Tom’s lightweight approach allows for quick implementation of a traffic filter on the server to block the malicious IP.Together, they present their evidence to the mayor, explaining how they detected and stopped the attack. The mayor, impressed by their teamwork, declares the mystery solved and the city’s website restored to normal operation.
Conclusion
While Wanda (Wireshark) offers a more user-friendly, visual approach to network analysis, Tom (tcpdump) provides a lightweight, versatile solution for quick captures and remote troubleshooting. Both tools have their strengths, and network detectives often use them in tandem to solve even the most complex network mysteries in Networkville. 🙂